Now Reading: U.S. Housing Market Downturn Analysis
-
01
U.S. Housing Market Downturn Analysis


Current U.S. Housing Market Trends and Crisis
- The 2008 housing crisis was historically significant, but the current market downturn is now considered the greatest housing crisis to date.
- After years of rising prices, housing inventory has surged, prices are falling, and experts agree the market frenzy is ending.
- Many major U.S. cities now report home prices lower than a year ago, with 21 consecutive months of year-over-year inventory growth.
- The housing market crash has effectively started already, providing an opportunity for buyers who have been waiting.
Predicting the Market Bottom Using a Historic Formula
- A 200-year-old loss formula has been discovered that predicts the absolute market bottom with perfect accuracy.
- Along with this formula, two other key factors are used to calculate:
- The exact month to buy
- The lowest price offer a buyer should make today
- In key cities:
- California home prices have dropped nearly 11% since the peak.
- Texas has seen over a 23% price drop, e.g., a $500,000 home now costs about $385,000.
- Housing supply has reached levels unseen since 2019, just before the last price explosion.
- The market crash actually began in late 2022, three years ago.
- The speaker has tracked the market for 5 years and helped 900 families buy homes, lending credibility to the analysis.
Current Price Drops Across States and Market Behavior
- Arizona and Florida lead in price declines:
- Arizona is down almost 40%.
- Florida is down about 30%.
- This is the first time since the Great Recession that so many rapid, large price drops have occurred simultaneously.
- Home sales volume recently hit a record low, even below 2008 levels, which paradoxically leads to rising inventory and falling prices.
- Housing inventory has almost doubled since mid-2022.
- The crucial question remains: When will the market bottom? This has been uncertain until now.
Mortgage Rates vs. Federal Funds Rate and Market Implications
- Despite the Federal Reserve cutting short-term interest rates twice this year, mortgage rates have actually increased.
- This is because mortgage rates follow the 10-year Treasury yield, influenced by investor sentiment, not the Fed’s short-term rates.
- Paradoxically, rising mortgage rates are beneficial in this context:
- If rates drop too quickly, demand surges, inventory vanishes, and prices spike again, recreating past bubbles.
- Waiting for mortgage rates to drop is not advisable; when they eventually do, it will likely be too late to buy affordably.
- The real problem is home prices, not mortgage rates.
Housing Market Forecast 2027 – USA
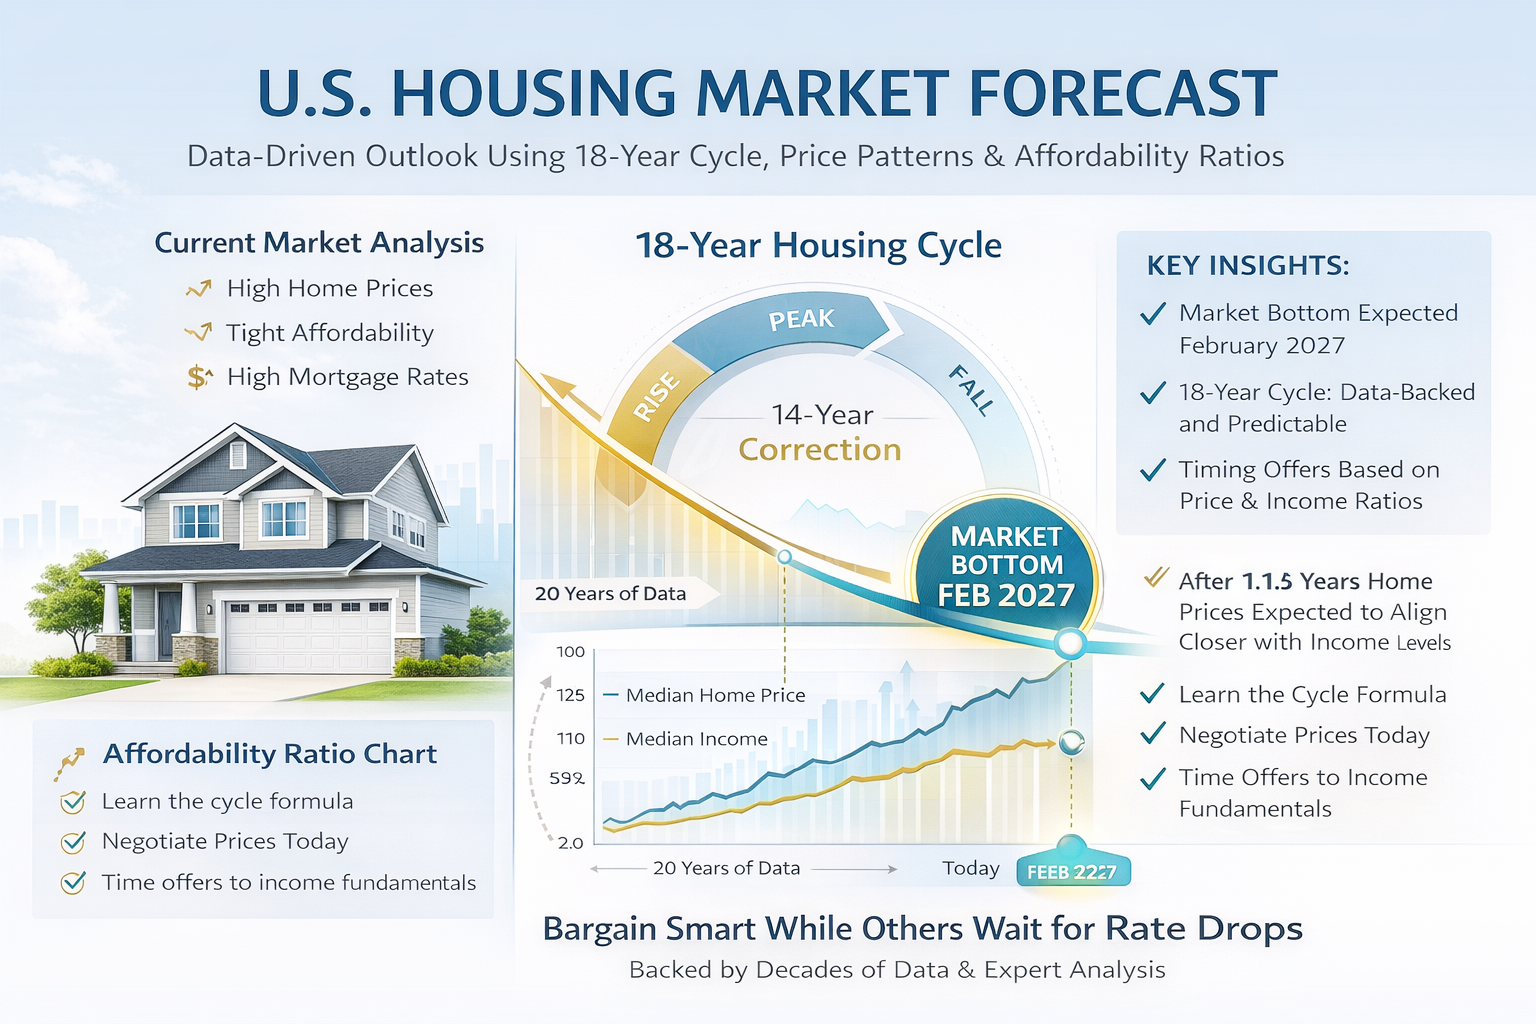
- The 200-Year-Old Housing Crash Formula: The 18-Year Cycle
- Economist Fred Harrison discovered a loss formula in 1983 that has predicted every major housing crash with perfect accuracy over two centuries.
- The formula identifies an 18-year real estate cycle consisting of:
- 7 years of slow price growth with a small mid-cycle dip
- 7 years of explosive price growth
- 4 years of market crash
- This cycle predicted:
- The 1981 mortgage crisis
- The 1989 UK crash
- The 2008 U.S. recession
- Over 12 complete cycles since the 1800s, the pattern has held true.
- The 2022 price peak corresponds to year 14 of the current 18-year cycle, positioning the market in the crash phase.
- However, this cycle alone is insufficient to predict the exact bottom because of unique current market conditions not seen in prior cycles.
Why the Cycle Repeats and Limitations
- The cycle repeats because every 18 years, policymakers forget the causes of previous crashes, leading to repeated mistakes and crashes.
- Understanding this cycle helps predict market phases but must be combined with other factors for precision.
2nd Factor: The Triple Peak Price Pattern
- Since the 2022 peak, home prices have exhibited a “triple peak” pattern—three successive lower peaks, a reliable crash indicator.
- This pattern also appeared:
- In the 1980s when mortgage rates hit 18%
- After the 2008 crash before the market bottomed
- Current home prices have dropped about 9% from the 2022 peak.
- However, based on a typical 2.6% annual price appreciation rate, home prices still need to fall another 9% to realign with normal trends.
- Example:
- If current prices are at $410,000, the expected bottom price should be around $374,000.
3rd Factor: Price-to-Income Ratio and Affordability Crisis
- The price-to-income ratio is critical to determine housing affordability and predict crash endings.
- Defined as:
[
\text{Price-to-Income Ratio} = \frac{\text{Price of Home}}{\text{Annual Income}}
] - A healthy market ratio is about 3.5x income. For example, a $100,000 income implies a $350,000 affordable home.
- Currently:
- Average American income ~$80,000/year
- Average home price ~$400,000
- Resulting ratio: 5 times income, indicating severe unaffordability
- To afford a home on average income, buyers would need to pay ~$175,000 to maintain a 3.5x ratio, but such homes do not exist in most markets.
- Historical bottom in 2009 saw the ratio near 3.7x, consistent with healthy affordability.
- Recent trends show the ratio decreasing from 5.8x to 4.9x over 3 years, moving toward the bottom but not there yet.
| Year | Price-to-Income Ratio | Market Phase |
|---|---|---|
| 2009 | 3.7 | Market Bottom (Crash End) |
| 2022 | 5.8 | Peak |
| 2025 | 4.9 | Approaching Bottom |
Integrating the Three Factors to Predict the Market Bottom
- The 18-year cycle suggests a 2-4 year crash duration from peak to bottom.
- Peak: June 2022 → Currently 3 years into the crash cycle.
- Prices still need to drop another 9%, at a rate of about $1,000 or 0.25% per month.
- Using price drop and income trends, the market bottom can be pinpointed beyond just the 18-year cycle.
Housing Market Forecast 2027 – USA
- Practical Buying Strategy: Applying the Formula
- For most U.S. markets (non-bubble), buyers should offer about 10% below asking price.
- Bubble markets, defined as those with price increases of more than 40% during COVID, require offers 20-25% below asking price.
- Example:
- $500,000 home → Offer $450,000 (10% less)
- $600,000 bubble market home → Offer $450,000-$480,000 (20-25% less)
- Bubble markets include states like Texas and Florida.
Final Determination of Market Bottom Date
- Price-to-income ratio is dropping 0.3x per year.
- From current data, the remaining price drop and affordability improvements indicate the bottom will arrive 16 months from November 2025, i.e., February 2027.
- February is historically the slowest month for housing and was the exact bottom during the 2009 crash, adding corroborative evidence.
- At this point:
- The 18-year cycle completes
- Prices return to normal appreciation levels
- Price-to-income ratio hits the 3.5x affordability mark
Summary of Recommendations
- Buyers who can wait should target February 2027 for the absolute market bottom.
- Those needing to buy sooner should use the formula:
- Offer 10% less than asking price nationwide
- Offer 20-25% less in bubble markets
- This approach increases chances of affordability and reduces overpaying during a volatile market.
Key Insights
- The U.S. housing market crash began in late 2022, not just recently.
- A 200-year-old 18-year cycle reliably predicts crash phases but needs supplementation from price and income data.
- The triple peak pattern is a strong crash indicator and is visible in today’s market.
- Affordability is the key metric: price-to-income ratio must return close to 3.5x to signal the bottom.
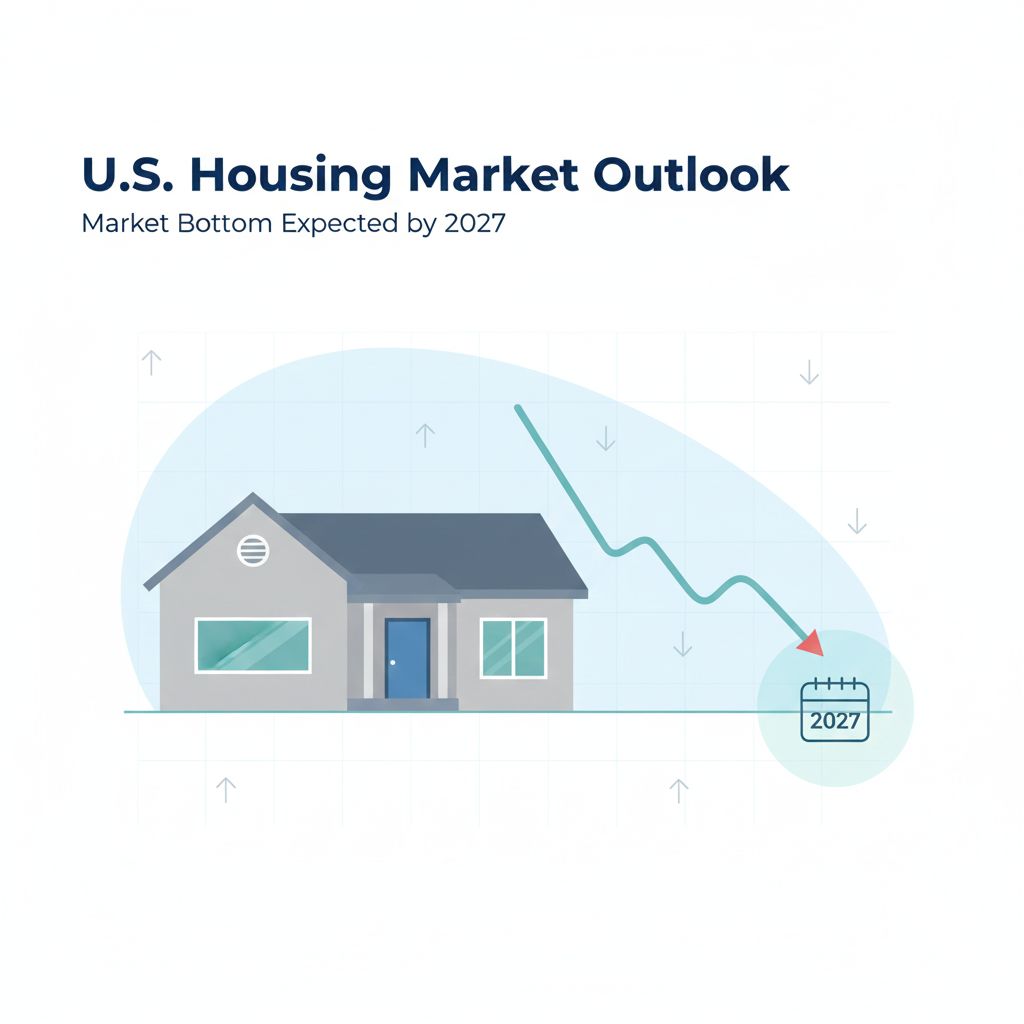
- The absolute bottom of the national housing market is projected for February 2027.
- Buyers should negotiate 10-25% below asking price depending on the market segment to maximize affordability.
Quantitative Summary Table
| Factor | Current Status | Historical Benchmark / Target | Implication |
|---|---|---|---|
| Housing Price Decline | ~9% from 2022 peak | Additional 9% decline needed | Bottom price ~9% lower than current prices |
| Price Appreciation Rate | Normally 2.6% per year | Return to 2.6% growth post-bottom | Prices must stabilize to this rate |
| Price-to-Income Ratio | ~4.9x (down from 5.8x in 2022) | 3.5x – 3.7x (2009 bottom) | Affordability improves as ratio decreases |
| Market Cycle Duration | Year 14 of 18-year cycle | Complete 18-year cycle every crash | Crash phase lasts 4 years |
| Predicted Market Bottom | February 2027 (16 months from Nov 2025) | Matches 2009 bottom date | Aligns time, price, and income factors |
Conclusion
This article reflects a comprehensive, data-driven forecast of the U.S. housing market downturn, grounded in a multi-factor analysis combining a historic 18-year cycle, price patterns, and affordability ratios. It concludes that while the market bottom is still about 1.5 years away (February 2027), buyers can use the formula to negotiate favorable prices today. Waiting for mortgage rate drops is counterproductive; the focus should be on timing offers to the underlying price and income fundamentals. This approach, backed by decades of data and expert experience, offers a credible roadmap for buyers navigating a complex housing crisis.